signal strength 3 of 5
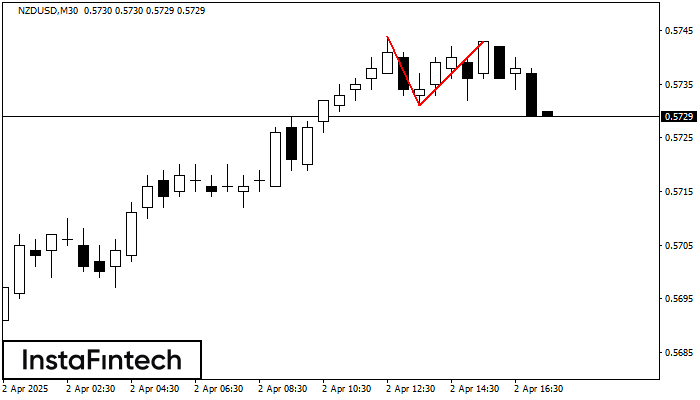
The Double Top reversal pattern has been formed on NZDUSD M30. Characteristics: the upper boundary 0.5744; the lower boundary 0.5731; the width of the pattern is 12 points. Sell trades are better to be opened below the lower boundary 0.5731 with a possible movements towards the 0.5701 level.
انظر أيضا
- All
- Double Top
- Flag
- Head and Shoulders
- Pennant
- Rectangle
- Triangle
- Triple top
- All
- #AAPL
- #AMZN
- #Bitcoin
- #EBAY
- #FB
- #GOOG
- #INTC
- #KO
- #MA
- #MCD
- #MSFT
- #NTDOY
- #PEP
- #TSLA
- #TWTR
- AUDCAD
- AUDCHF
- AUDJPY
- AUDUSD
- EURCAD
- EURCHF
- EURGBP
- EURJPY
- EURNZD
- EURRUB
- EURUSD
- GBPAUD
- GBPCHF
- GBPJPY
- GBPUSD
- GOLD
- NZDCAD
- NZDCHF
- NZDJPY
- NZDUSD
- SILVER
- USDCAD
- USDCHF
- USDJPY
- USDRUB
- All
- M5
- M15
- M30
- H1
- D1
- All
- Buy
- Sale
- All
- 1
- 2
- 3
- 4
- 5
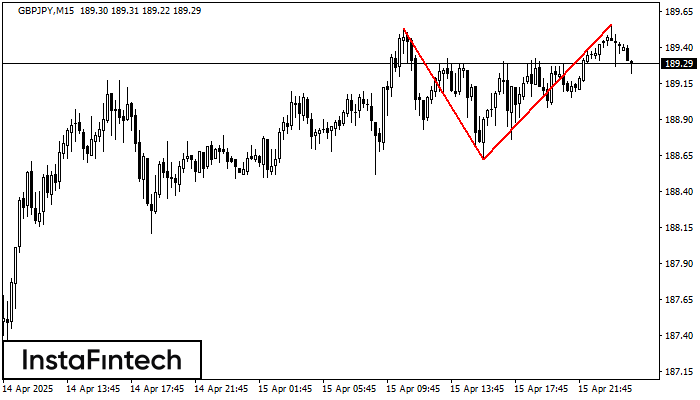
The Double Top pattern has been formed on GBPJPY M15. It signals that the trend has been changed from upwards to downwards. Probably, if the base of the pattern 188.62
The M5 and M15 time frames may have more false entry points.
Open chart in a new window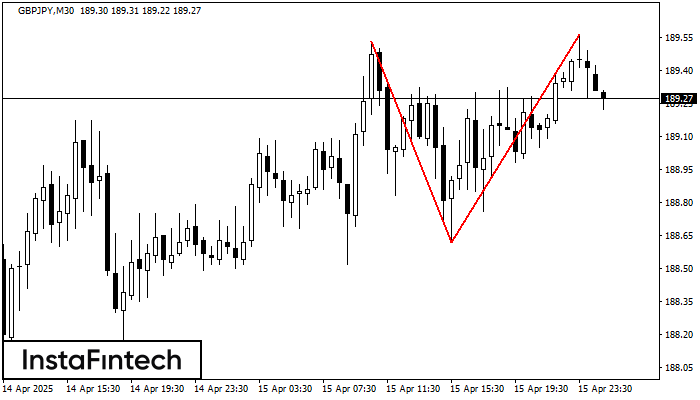
The Double Top reversal pattern has been formed on GBPJPY M30. Characteristics: the upper boundary 189.53; the lower boundary 188.62; the width of the pattern is 94 points. Sell trades
Open chart in a new window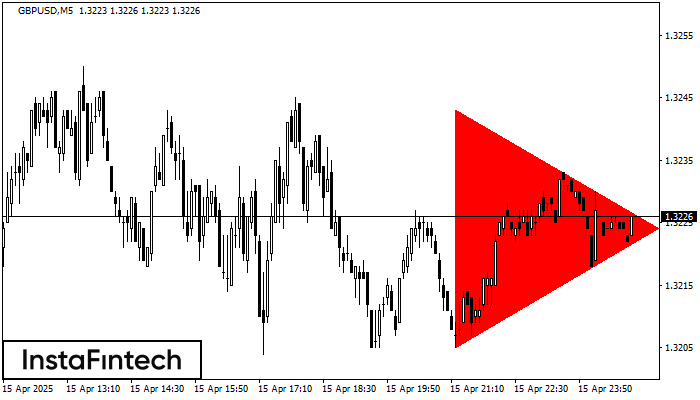
According to the chart of M5, GBPUSD formed the Bearish Symmetrical Triangle pattern. This pattern signals a further downward trend in case the lower border 1.3205 is breached. Here
The M5 and M15 time frames may have more false entry points.
Open chart in a new window