empty
07.07.2023 12:03 PM
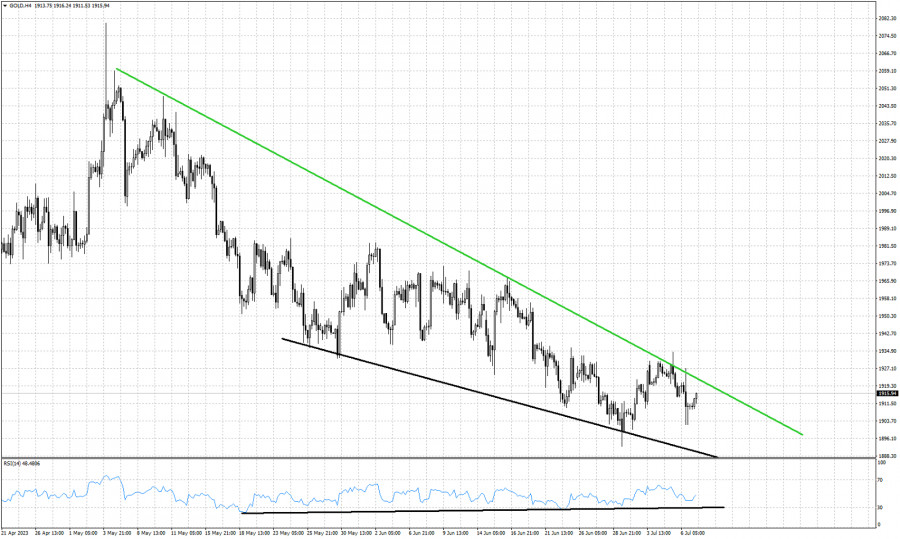
Technical analysis on Gold for July 7th, 2023.

This image is no longer relevant

Green line - resistance

Black lines- bullish RSI divergence

Gold price is trading around $1,915. Technically trend remains bearish as price continues making lower highs and lower lows. As we saw in our Ichimoku cloud analysis, Gold price has not yet broken above the cloud resistance. In today's chart we see a wedge pattern formation in play. A new low is not out of the question as price continues to trade below the green trend line. As long as this is the case, bears remain in control. The RSI provides bullish divergence signals, implying that a reversal is imminent. But these divergence signs are not reversal signs. Only a warning. Bulls need to recapture $1,935 in order to reclaim control of the trend.

Alexandros Yfantis,
InstaForex के विश्लेषणात्मक विशेषज्ञ
© 2007-2025
समय सीमा चुनें
5
मिनट
15
मिनट
30
मिनट
1
घंटा
4
घंटे
1
दिन
1
सप्ताह
Earn on cryptocurrency rate changes with InstaForex
Download MetaTrader 4 and open your first trade
  • Grand Choice
    Contest by
    InstaForex
    InstaForex always strives to help you
    fulfill your biggest dreams.
    कॉन्टेस्ट में हिस्सा लें

अनुशंसित लेख

एयूडी/यूएसडी का पूर्वानुमान, 25 मार्च 2025 के लिए

ऑस्ट्रेलियाई डॉलर साइडवेज ट्रेंड रेंज की निचली सीमा को तोड़ने से बच गया और कल 11 पिप्स बढ़ा। हालांकि, दैनिक स्तर पर बैलेंस इंडिकेटर लाइन (लाल मूविंग एवरेज) ने कीमत

Laurie Bailey 08:32 2025-03-25 UTC+2

जीबीपी/यूएसडी का पूर्वानुमान, 25 मार्च 2025 के लिए

कल, ब्रिटिश पाउंड चार पिप्स बढ़ा, जिससे मार्लिन ऑस्सीलेटर नीचे गया और शून्य रेखा को छू लिया। अब हम उम्मीद कर सकते हैं कि ऊपर की ओर सिग्नल मजबूत होगा

Laurie Bailey 08:28 2025-03-25 UTC+2

ईयूआर/यूएसडी का पूर्वानुमान, 25 मार्च 2025 के लिए

सोमवार को यूरो 14 पिप्स गिरा। ऊपर की ओर पलटाव करने की कोशिश की गई। आज एक और कोशिश संभव है और यह अधिक सफल हो सकती है, हालांकि 1.0762

Laurie Bailey 08:20 2025-03-25 UTC+2

सोने की कमोडिटी उपकरण के इंट्राडे मूल्य गति का तकनीकी विश्लेषण, मंगलवार, 25 मार्च 2025।

अगर हम सोने की कमोडिटी उपकरण के 4 घंटे के चार्ट को देखें, तो एक बियरिश 123 पैटर्न दिखाई देता है, इसके बाद कई बियरिश रॉस हुक (RH) आते हैं

Arief Makmur 08:17 2025-03-25 UTC+2

ईयूआर/जेपीवाई क्रॉस करेंसी पेयर की इंट्राडे मूल्य गति का तकनीकी विश्लेषण, मंगलवार, 25 मार्च 2025।

जो 4 घंटे के चार्ट पर ईयूआर/जेपीवाई क्रॉस करेंसी पेयर में देखा जा रहा है, वह स्पष्ट रूप से यह दिखा रहा है कि ईयूआर/जेपीवाई एक सुदृढ़ स्थिति में बढ़

Arief Makmur 08:15 2025-03-25 UTC+2

24-29 मार्च के लिए साप्ताहिक तकनीकी विश्लेषण: GBP/USD मुद्रा जोड़ी

पिछले सप्ताह, यह जोड़ी नीचे की ओर बढ़ी और 1.2879 (लाल धराशायी रेखा) पर 14.6% रिट्रेसमेंट स्तर का परीक्षण किया, जिससे साप्ताहिक मोमबत्ती 1.2915 पर बंद हुई। आने वाले सप्ताह

Stefan Doll 18:41 2025-03-24 UTC+2

24-29 मार्च के लिए साप्ताहिक तकनीकी विश्लेषण: EUR/USD मुद्रा जोड़ी

पिछले सप्ताह, यह जोड़ी नीचे की ओर बढ़ी और 1.0948 (हल्के नीले रंग की धराशायी रेखा) के ऐतिहासिक प्रतिरोध स्तर का परीक्षण किया, जिसके बाद कीमत में गिरावट

Stefan Doll 18:40 2025-03-24 UTC+2

EUR/USD. 24 मार्च. एक नया सप्ताह – नए अवसर

शुक्रवार को, EUR/USD जोड़ी 1.0857 पर 200.0% सुधार स्तर से पलट गई और 1.0781–1.0797 के समर्थन क्षेत्र में गिर गई। इस क्षेत्र से पलटाव ने यूरो के पक्ष में काम

Samir Klishi 18:38 2025-03-24 UTC+2

GBP/USD. 24 मार्च. ब्रिटिश पाउंड ने नए सप्ताह की शुरुआत पूरी गति से की

प्रति घंटा चार्ट पर, GBP/USD जोड़ी ने शुक्रवार को अपनी गिरावट जारी रखी और 1.2931 के स्तर से भी नीचे समेकित हुई। हालाँकि, यह गिरावट अल्पकालिक थी, क्योंकि पाउंड

Samir Klishi 18:35 2025-03-24 UTC+2

यूएसडी/आईडीआर एक्सोटिक करेंसी जोड़ी की दैनिक मूल्य आंदोलन का तकनीकी विश्लेषण, सोमवार, 24 मार्च, 2025।

दैनिक चार्ट पर, एक्सोटिक करेंसी जोड़ी USD/IDR बैलिश पिचफोर्क चैनल में गति करती हुई प्रतीत होती है, जिसे इस एक्सोटिक करेंसी जोड़ी की मूल्य आंदोलन द्वारा पुष्टि की गई है

Arief Makmur 09:17 2025-03-24 UTC+2
अभी बात नहीं कर सकते?
अपना प्रश्न पूछें बातचीत.
Widget callback
 

Dear visitor,

Your IP address shows that you are currently located in the USA. If you are a resident of the United States, you are prohibited from using the services of InstaFintech Group including online trading, online transfers, deposit/withdrawal of funds, etc.

If you think you are seeing this message by mistake and your location is not the US, kindly proceed to the website. Otherwise, you must leave the website in order to comply with government restrictions.

Why does your IP address show your location as the USA?

  • - you are using a VPN provided by a hosting company based in the United States;
  • - your IP does not have proper WHOIS records;
  • - an error occurred in the WHOIS geolocation database.

Please confirm whether you are a US resident or not by clicking the relevant button below. If you choose the wrong option, being a US resident, you will not be able to open an account with InstaForex anyway.

We are sorry for any inconvenience caused by this message.