signal strength 1 of 5
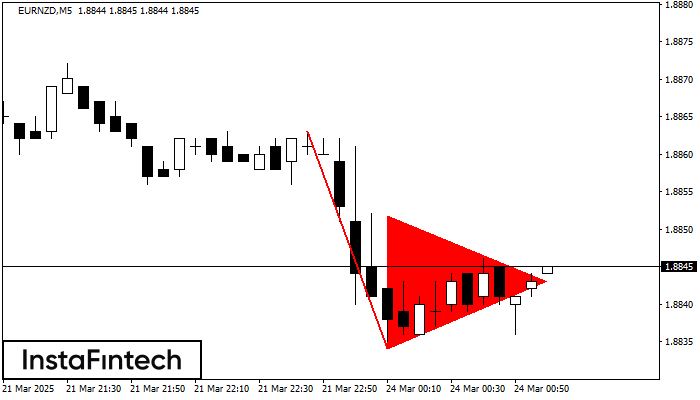
The Bearish pennant pattern has formed on the EURNZD M5 chart. It signals potential continuation of the existing trend. Specifications: the pattern’s bottom has the coordinate of 1.8834; the projection of the flagpole height is equal to 29 pips. In case the price breaks out the pattern’s bottom of 1.8834, the downtrend is expected to continue for further level 1.8819.
The M5 and M15 time frames may have more false entry points.
See Also
- All
- Double Top
- Flag
- Head and Shoulders
- Pennant
- Rectangle
- Triangle
- Triple top
- All
- #AAPL
- #AMZN
- #Bitcoin
- #EBAY
- #FB
- #GOOG
- #INTC
- #KO
- #MA
- #MCD
- #MSFT
- #NTDOY
- #PEP
- #TSLA
- #TWTR
- AUDCAD
- AUDCHF
- AUDJPY
- AUDUSD
- EURCAD
- EURCHF
- EURGBP
- EURJPY
- EURNZD
- EURRUB
- EURUSD
- GBPAUD
- GBPCHF
- GBPJPY
- GBPUSD
- GOLD
- NZDCAD
- NZDCHF
- NZDJPY
- NZDUSD
- SILVER
- USDCAD
- USDCHF
- USDJPY
- USDRUB
- All
- M5
- M15
- M30
- H1
- D1
- All
- Buy
- Sale
- All
- 1
- 2
- 3
- 4
- 5

According to the chart of M5, NZDCAD formed the Inverse Head and Shoulder pattern. The Head’s top is set at 0.7878 while the median line of the Neck is found
The M5 and M15 time frames may have more false entry points.
Open chart in a new window
The Triple Bottom pattern has been formed on NZDUSD H1. It has the following characteristics: resistance level 0.5638/0.5621; support level 0.5515/0.5481; the width is 123 points. In the event
Open chart in a new window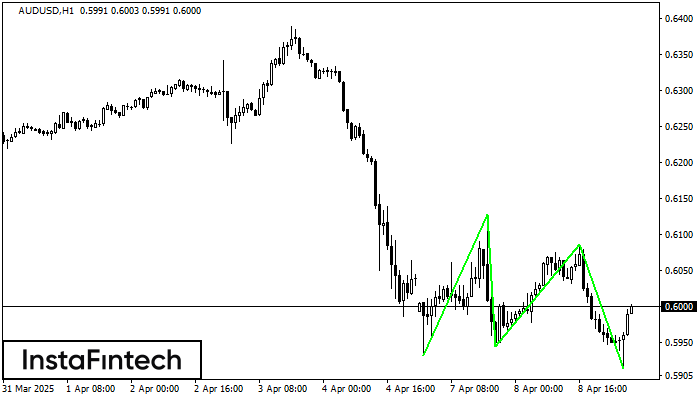
The Triple Bottom pattern has been formed on AUDUSD H1. It has the following characteristics: resistance level 0.6128/0.6086; support level 0.5933/0.5915; the width is 195 points. In the event
Open chart in a new window