empty
30.09.2024 04:52 PM
Analysis for GBP/USD on September 30th: The British Pound Unaffected by GDP Data

This image is no longer relevant

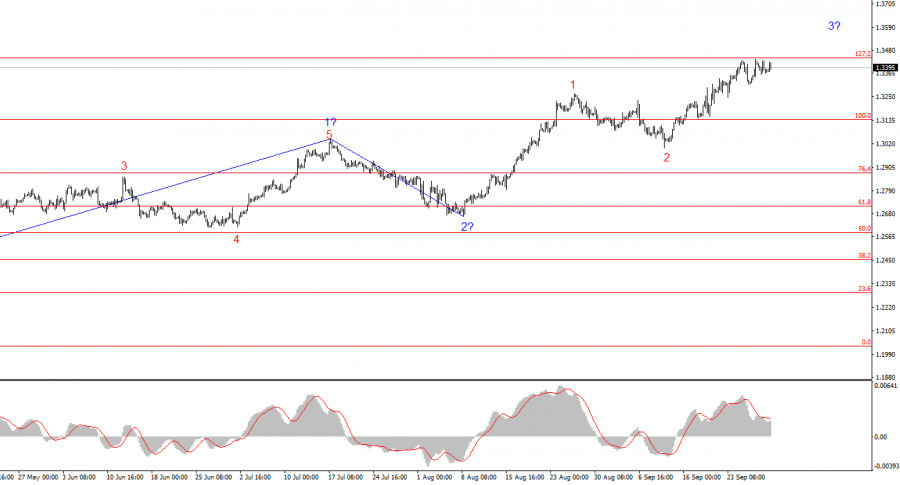
The wave structure of the GBP/USD pair remains complex and is evolving into an increasingly prolonged pattern. Initially, the wave structure seemed convincing and suggested the formation of a downward series of waves targeting levels below 1.2300. However, in practice, demand for the British pound continues to grow, disrupting potential wave formations. The market persistently increases long positions.

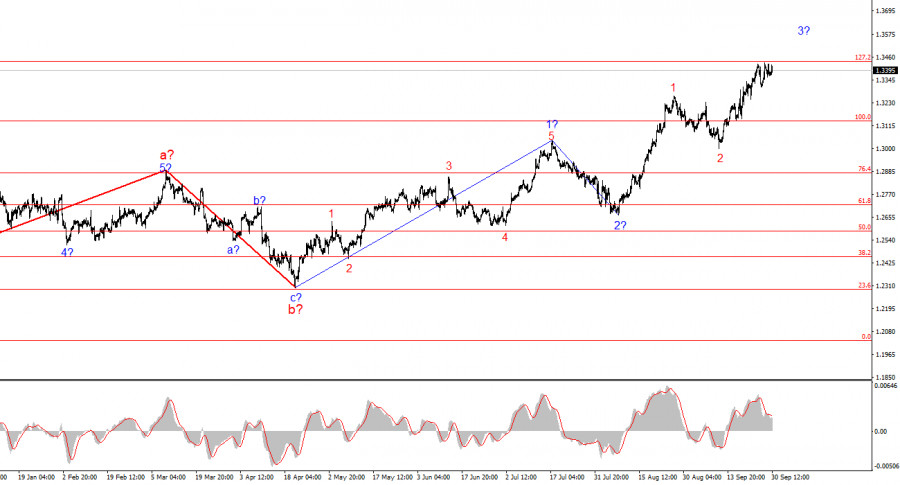
At present, it appears that the upward segment of the trend, which began on April 22, has become significantly more complicated. If this assumption is correct, we have already observed waves 1 and 2 within wave c. Consequently, the construction of the third upward wave in c likely began on August 8, and this wave is developing into an extended five-wave structure. Therefore, the British pound could potentially rise to the 1.4000 level, representing just the third wave in the projected c. A fifth wave might follow, which could also form a complete five-wave structure.

The U.S. dollar continues to weaken.

The GBP/USD pair rose by 20 basis points on Monday, and overall, demand for the U.S. dollar is steadily declining. Although the pound failed to break last week's highs today, it seems that this could happen very soon. The market demonstrated on Monday the direction it is prepared to take.

The only notable report today was the UK's Q2 GDP data, which revealed that the British economy's growth rate was lower than both previous estimates and market expectations. The economy expanded by just 0.5% on a quarterly basis and 0.7% on an annual basis, compared to the anticipated growth of 0.7% quarter-on-quarter and 0.9% year-on-year. Consequently, this report fell short of market expectations.

However, the market didn't react negatively and instead ignored the report, as it didn't fit the prevailing narrative. Demand for the pound began rising steadily from the morning. By the end of the day (especially during the US session), the dollar might recover, but the fact that the market is buying the pound despite weak UK data is highly indicative of current market sentiment.

This week, key data will be released from the U.S., and it's expected that market participants will pay close attention to the most negative reports while potentially ignoring positive ones. Under these conditions, the U.S. dollar may face significant challenges. On shorter-term charts, it's evident that the price is approaching the 1.3440 level, and this level could be breached as early as tomorrow. According to the current wave structure, demand for the pound is expected to rise for an extended period.

This image is no longer relevant

Overall Conclusions

The wave structure of the GBP/USD pair continues to become more complex. If the upward trend began on April 22, it is likely to develop over a considerable period. I still consider selling opportunities more attractive, but they require clear signals. At the moment, there is little doubt that a new upward wave has begun and is ongoing. The nearest target for this wave is the 1.3440 level, which corresponds to 127.2% on the Fibonacci scale. A successful breakout of this level might propel the market toward the 1.3800 level.

On a higher wave scale, the wave pattern has evolved. We can now assume the formation of a complex and extended corrective upward wave structure. Currently, this appears to be a three-wave pattern, but it could develop into a five-wave structure, which may take several more months to complete.

Key Principles of My Analysis:

  1. Wave structures should be simple and understandable. Complex structures are challenging to trade and frequently change.
  2. If you're not confident about the market situation, it's best to stay out.
  3. There is never 100% certainty in the direction of movement. Always remember to use Stop Loss orders for protection.
  4. Wave analysis can be combined with other types of analysis and trading strategies.
Chin Zhao,
انسٹافاریکس کا تجزیاتی ماہر
© 2007-2025
ٹائم فریم منتخب کریں
5
منٹ
15
منٹ
30
منٹ
1
گھنٹہ
4
گھنٹے
1
دن
1
ہفتہ
انسٹافاریکس کے ساتھ کرپٹو کرنسی کی معاملاتی تبدیلیوں سے کمائیں۔
میٹا ٹریڈر 4 ڈاؤن لوڈ کریں اور اپنی پہلی ٹریڈ کھولیں۔
  • Grand Choice
    Contest by
    InstaForex
    InstaForex always strives to help you
    fulfill your biggest dreams.
    مقابلہ میں شامل ہوں

تجویز کردہ مضامین

جنوری 03 2025 کو یورو / یو ایس ڈی کے لیے تجزیہ

یورو / یو ایس ڈی کے لیے 4 گھنٹے کے چارٹ کی لہر کا ڈھانچہ تیزی سے واضح اور دلچسپ ہوتا جا رہا ہے۔ جنوری 2024 سے، میں 16 اپریل

Chin Zhao 14:59 2025-01-06 UTC+2

جی بی پی / یو ایس ڈی میں ویوو کا تجزیہ برائے 30 اکتوبر 2024

اصلاحی ویوو کے ابھی تک کوئی آثار نظر نہیں آئے۔ بدھ کو جی بی پی / یو ایس ڈی میں 15 بیسز پوائنٹ کی کمی کے باوجود، امریکی سیشن

Chin Zhao 18:48 2024-10-30 UTC+2

جی بی پی / یو ایس ڈی کا تجزیہ برائے 02 اکتوبر 2024

جی بی پی / یو ایس ڈی کے لیے ویوو کا نمونہ کافی پیچیدہ ہے اور اس میں توسیع ہوتی رہتی ہے۔ کچھ عرصے کے لیے، ویوو کا ڈھانچہ قائل

Chin Zhao 20:46 2024-10-02 UTC+2

جی بی پی / یو ایس دی تجزیہ - 1 اکتوبر: پاؤنڈ غیر متزلزل رہتا ہے۔

جی بی پی / یو ایس ڈی کے لیے ویوو کا نمونہ کافی پیچیدہ ہے اور تیزی سے توسیع شدہ شکل اختیار کرنا جاری رکھے ہوئے ہے۔ ایک موقع پر،

Chin Zhao 18:12 2024-10-01 UTC+2

ستمبر 25 سے جی بی پی / یو ایس ڈی, اے یو ڈی / یو ایس ڈی, ییو ایس ڈی / سی ایچ ایف, یورو / جے پی وائے, اے یو ڈی / جے پی وائے, یو ایس ڈی انڈیکس، #بِٹ کوائن کے لیے آسان لہر تجزیہ پر مبنی ہفتہ وار پیشن گوئی

اگلے چند دنوں میں، برطانوی پاؤنڈ کے بتدریج ایک طرف کے رجحان میں جانے کی توقع ہے۔ ہفتے کے دوسرے نصف میں، ایک الٹ اور قیمت میں کمی کے آغاز

Isabel Clark 15:01 2024-09-30 UTC+2

یورو / یو ایس ڈی، یوایس ڈی/ جے پی وائے، جی بی پی / جے پی وائے، یو ایس ڈی / سی اے ڈی، این ذیڈ ڈی / یو ایس ڈی، یورو / جی بی پی، اور گولڈ کے لیے سیمپلی فائیڈ تجزیہ پر مبنی ہفتہ وار پیشن گوئی

اگلے چند دنوں کے دوران، یورو ریزسٹنس زون کے ساتھ ساتھ آگے بڑھنے کی توقع ہے۔ اس کے بعد، حالات تبدیل ہو سکتے ہیں اور قیمت میں کمی کا آغاز

Isabel Clark 14:12 2024-09-30 UTC+2

ستمبر 25 کو جی بی پی / یو ایس ڈی پئیر کا تجزیہ۔ مارکیٹ طویل پوزیشنوں میں اضافہ جاری رکھے ہوئے ہے۔

بدھ تک جی بی پی / یو ایس ڈی کی شرح میں 10 بیسس پوائنٹس کی کمی واقع ہوئی تھی لیکن اہم فوائد کے ساتھ دن کے اختتام اور مثبت

Chin Zhao 19:41 2024-09-25 UTC+2

ستمبر 10 2024 کو جی بی پی / یو ایس ڈی پئیر کے لیے تجزیہ

جی بی پی / یو ایس ڈی کے لیے ویو کی ساخت پیچیدہ اور انتہائی مبہم ہے۔ تھوڑی دیر کے لیے، لہر کا نمونہ قائل نظر آیا، جو 1.2300

Chin Zhao 19:53 2024-09-10 UTC+2

اگست 30 2024 کو جی بی پی/یو ایس ڈی کا تجزیہ

جی بی پی / یو ایس ڈی کی ویو پیٹرن کافی پیچیدہ اور غیر واضح بنی ہوئی ہے۔ کچھ عرصے تک، ویو ڈھانچہ کافی قائل کرنے والا

Chin Zhao 22:11 2024-08-30 UTC+2

اگست 27 2024 کو جی بی پی / یو ایس ڈی کا تجزیہ

جی بی پی / یو ایس ڈی کے لیے لہر کا نمونہ کافی پیچیدہ اور مبہم ہو گیا ہے۔ کچھ وقت کے لیے، لہر کا ڈھانچہ قائل

Chin Zhao 19:50 2024-08-27 UTC+2
ابھی فوری بات نہیں کرسکتے ؟
اپنا سوال پوچھیں بذریعہ چیٹ.
Widget callback
 

Dear visitor,

Your IP address shows that you are currently located in the USA. If you are a resident of the United States, you are prohibited from using the services of InstaFintech Group including online trading, online transfers, deposit/withdrawal of funds, etc.

If you think you are seeing this message by mistake and your location is not the US, kindly proceed to the website. Otherwise, you must leave the website in order to comply with government restrictions.

Why does your IP address show your location as the USA?

  • - you are using a VPN provided by a hosting company based in the United States;
  • - your IP does not have proper WHOIS records;
  • - an error occurred in the WHOIS geolocation database.

Please confirm whether you are a US resident or not by clicking the relevant button below. If you choose the wrong option, being a US resident, you will not be able to open an account with InstaForex anyway.

We are sorry for any inconvenience caused by this message.