empty
17.12.2024 03:30 AM
Trading Recommendations and Review of EUR/USD on December 17; Rollercoaster Within the Flat Range

EUR/USD 5-Minute Analysis

This image is no longer relevant

The EUR/USD currency pair continued to trade within a flat range on Monday – for the fourth consecutive week. Interestingly, the British pound is forming an upward correction at the same time, which further confirms our perspective on the pound's strong resistance. In other words, under identical fundamental and macroeconomic conditions, the pound rises more frequently and falls less often than the euro.

Yesterday, PMI indices in the Eurozone showed mixed results. While the services sector in Germany and the EU posted solid figures, the manufacturing sector again declined. The same situation occurred in the U.S., where the services sector grew, but the manufacturing sector showed a new decline. As a result, the euro traded logically on the first trading day of the week with no surprises. The only questions are about the pound, which continues to trade irrationally.

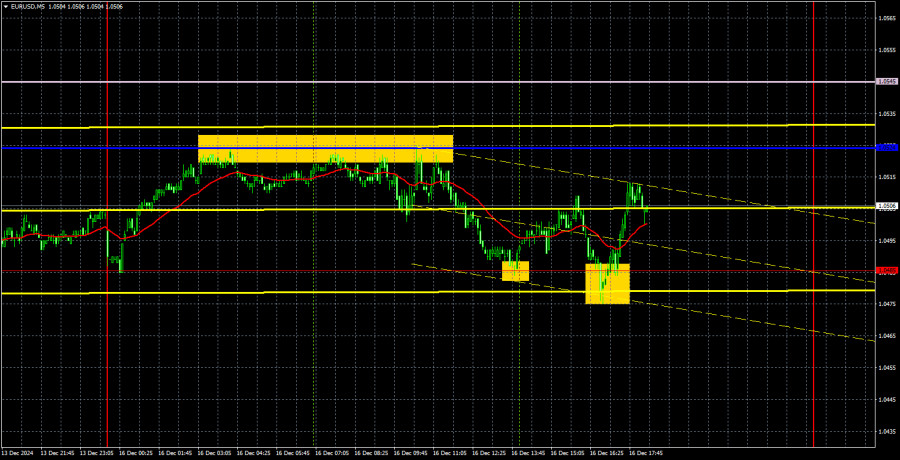
For EUR/USD, we are still waiting for the flat phase to end. While no one prohibits opening trades within the flat range, traders understand the nature of movements in a limited price range. In the 5-minute timeframe, it is clear how frequently the price changes direction, although decent trading signals still form occasionally.

For example, during the European session yesterday, the price rebounded multiple times off the Kijun-sen line very accurately. Therefore, short positions could be opened. During the U.S. session, the price rebounded twice from the nearest support level of 1.0485, which served as signals to close shorts and open long positions. Although the gains from long positions were limited, there was no loss either, as the price moved in the right direction by at least 20 pips. Monday turned out to be flat, but some profits were still allowed.

COT Report

This image is no longer relevant

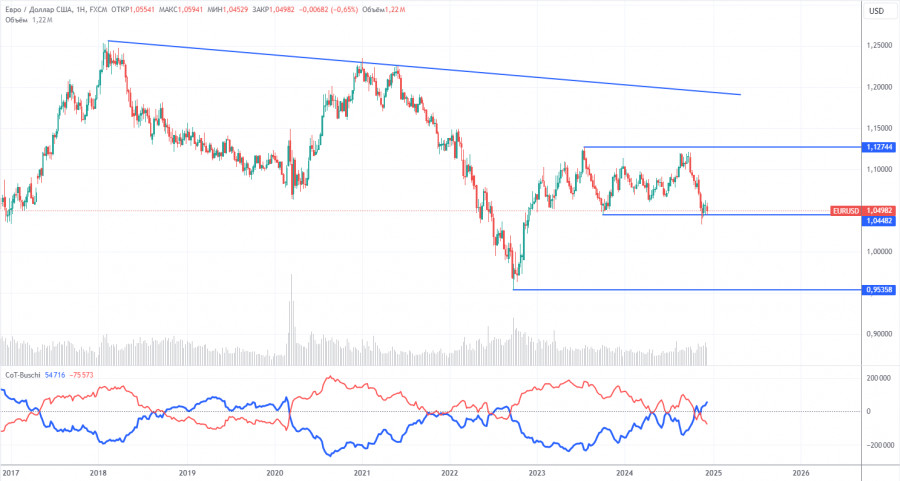
The latest COT report, dated December 10, provides a clear picture of market sentiment. As shown in the illustration above, the net position of non-commercial traders has long remained bullish, but bears have recently gained dominance. Two months ago, the number of open short positions among professional traders increased sharply, turning the net position negative for the first time in a long while. This indicates that the euro is now being sold more often than bought.

We still see no fundamental factors supporting the euro's strengthening, and technical analysis indicates the price is in a consolidation zone—essentially, a flat market. On the weekly timeframe, it's clear that since December 2022(!!!), the pair has been trading between 1.0448 and 1.1274. Therefore, a further decline remains more likely. Breaking below the 1.0448 level will open new territory for a euro sell-off.

The red and blue lines have crossed and switched positions relative to one another, signaling a bearish trend in the market. During the last reporting week, the number of longs in the non-commercial group decreased by 10,300, while shorts increased by 7,700. As a result, the net position fell by another 18,000.

EUR/USD 1-Hour Analysis

This image is no longer relevant

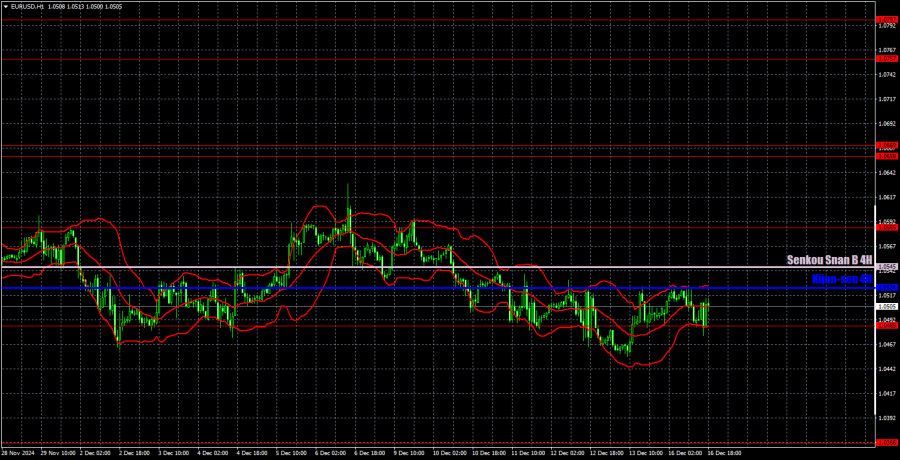
On the hourly timeframe, the pair continues to correct and remains within the visible horizontal channel. As we expected, the correction is complex and slow. We still believe there are no reasons for a significant rise in the euro. Therefore, we will wait for the correction to end and for the pair to resume its downward movement toward parity levels. For example, consolidation below 1.0460 will signal a potential resumption of the downtrend.

For December 17, we highlight the following levels for trading: 1.0269, 1.0340-1.0366, 1.0485, 1.0585, 1.0658-1.0669, 1.0757, 1.0797, 1.0843, 1.0889, 1.0935, as well as the Senkou Span B (1.0545) and Kijun-sen (1.0524) lines. The Ichimoku indicator lines may shift during the day, which must be considered when determining trading signals. Don't forget to set the Stop Loss order to break even after the price moves 15 pips in the right direction. This will protect against potential losses if the signal turns out to be false.

In the Eurozone, no significant events are scheduled aside from a few ZEW and IFO indices from Germany. We consider this data secondary. In the U.S., reports on industrial production and retail sales will be published, which are of greater interest. However, these reports are unlikely to end the flat range. We will have to wait for the Federal Reserve meeting.

Illustration Explanations:

  • Support and Resistance Levels (thick red lines): Key areas where price movement might stall. Not sources of trading signals.
  • Kijun-sen and Senkou Span B Lines: Ichimoku indicator lines transferred from the H4 timeframe to the hourly chart, serving as strong levels.
  • Extreme Levels (thin red lines): Points where the price has previously rebounded. They can serve as trading signal sources.
  • Yellow Lines: Trendlines, channels, or other technical patterns.
  • Indicator 1 on COT Charts: Reflects the net position size of each trader category.
Paolo Greco,
Especialista em análise na InstaForex
© 2007-2024
Selecionar intervalo de tempo
5
min
15
min
30
min
1
hora
4
horas
1
dia
1
s.
Ganhe com as variações das taxas das criptomoedas com a InstaForex.
Baixe o MetaTrader 4 e abra a sua primeira operação.
  • Grand Choice
    Contest by
    InstaForex
    InstaForex always strives to help you
    fulfill your biggest dreams.
    PARTICIPE DO CONCURSO

Recommended Stories

GBP/USD: Plano de negociação para a sessão dos E.U. de 20 de dezembro (revisão das negociações da manhã). A libra se recuperou ligeiramente

Em minha previsão matinal, destaquei o nível 1,2526 como um ponto-chave para entrar no mercado. Observando o gráfico de 5 minutos, a libra subiu, mas não testou 1,2526

Miroslaw Bawulski 15:22 2024-12-20 UTC+2

Como negociar o par GBP/USD em 19 de dezembro? Dicas simples e análise de negociação para iniciantes

Análise das negociações de quarta-feira Gráfico 1H do GBP/USD Na quarta-feira, o par GBP/USD registrou uma queda acentuada devido ao aumento repentino do sentimento hawkish na Reserva Federal. Conforme mencionado

Paolo Greco 13:52 2024-12-19 UTC+2

EUR/USD: 18 de dezembro - Plano de negociação para a sessão dos E.U. (Análise das negociações da manhã). A inflação da zona do euro continua a cair

Em minha previsão da manhã, destaquei o nível 1,0506 como um ponto-chave de decisão para a entrada no mercado. Vamos dar uma olhada no gráfico de 5 minutos para entender

Miroslaw Bawulski 21:00 2024-12-18 UTC+2

GBP/USD: Plano de Negociação para a Sessão dos E.U. de 18 de dezembro (Revisão das Negociações da Manhã). A libra sobe após o aumento da inflação

Em minha previsão matinal, destaquei 1,2695 como um nível-chave para decisões de entrada no mercado. Vamos analisar o gráfico de 5 minutos para entender o resultado. Embora tenha ocorrido

Miroslaw Bawulski 20:47 2024-12-18 UTC+2

Como negociar o par GBP/USD em 18 de dezembro? Dicas simples e análise de negociação para iniciantes

Análise das negociações de terça-feira Gráfico de 1H do GBP/USD O par GBP/USD continuou seu movimento de alta na terça-feira, iniciado na segunda-feira. Ontem, o mercado teve motivos válidos para

Paolo Greco 14:53 2024-12-18 UTC+2

EUR/USD: Plano de negociação para a sessão dos E.U.A. de 17 de dezembro (análise das negociações da manhã)

Na minha previsão para a manhã, observei o nível de 1,0506 e planejei tomar decisões de negociação a partir daí. Vamos dar uma olhada no gráfico de 5 minutos

Miroslaw Bawulski 21:18 2024-12-17 UTC+2

GBP/USD: Plano de negociação para a sessão dos E.U.A de 17 de dezembro (análise das negociações da manhã). A libra subiu após dados do mercado de trabalho

Na minha previsão da manhã, fiquei atento ao nível de 1,2665 e planejei tomar decisões de negociação a partir daí. Vamos dar uma olhada no gráfico de 5 minutos

Miroslaw Bawulski 19:08 2024-12-17 UTC+2

GBP/USD: Plano para a sessão dos E.U.A. de 11 de dezembro (Análise das negociações da manhã). Pressão sobre o retorno da libra

Na minha previsão da manhã, foquei no nível 1,2758 e planejei tomar decisões de negociação com base nele. Vamos dar uma olhada no gráfico de 5 minutos e analisar

Miroslaw Bawulski 19:29 2024-12-11 UTC+2

EUR/USD: 5 de dezembro - Plano de negociação para a sessão dos E.U.A. (Análise da negociação da manhã)

Em minha previsão da manhã, identifiquei o nível 1,0543 como uma área-chave para decisões de entrada no mercado. Uma análise do gráfico de 5 minutos mostra que um aumento

Miroslaw Bawulski 19:33 2024-12-05 UTC+2

GBP/USD: Plano de negociação para a sessão dos E.U.A de 5 de dezembro (análise da negociação da manhã). A libra se aproximou de 1,2740

Em minha previsão da manhã, identifiquei o nível 1,2718 como uma área-chave para decisões de entrada no mercado. Uma análise do gráfico de 5 minutos revela que um aumento

Miroslaw Bawulski 19:01 2024-12-05 UTC+2
Não pode falar agora?
Faça sua pergunta no chat.
Widget callback
 

Dear visitor,

Your IP address shows that you are currently located in the USA. If you are a resident of the United States, you are prohibited from using the services of InstaFintech Group including online trading, online transfers, deposit/withdrawal of funds, etc.

If you think you are seeing this message by mistake and your location is not the US, kindly proceed to the website. Otherwise, you must leave the website in order to comply with government restrictions.

Why does your IP address show your location as the USA?

  • - you are using a VPN provided by a hosting company based in the United States;
  • - your IP does not have proper WHOIS records;
  • - an error occurred in the WHOIS geolocation database.

Please confirm whether you are a US resident or not by clicking the relevant button below. If you choose the wrong option, being a US resident, you will not be able to open an account with InstaForex anyway.

We are sorry for any inconvenience caused by this message.