empty
04.12.2023 10:23 AM
Weekly forecast for simplified wave analysis of GBP/USD, AUD/USD, USD/CHF, EUR/JPY, EUR/CHF, and US dollar index from December 4th

GBP/USD

Brief Analysis:

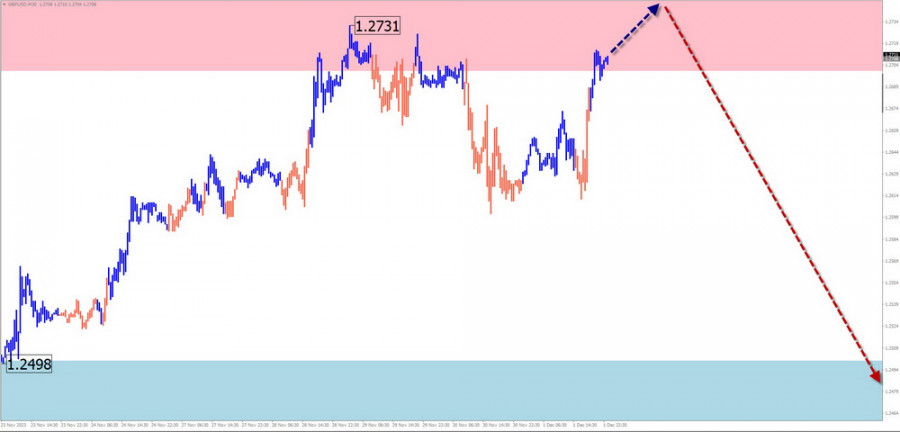
The ascending wave has defined the major trend of the British pound since the beginning of October. The wave level of the current segment allows classifying its scale as a daily time frame (TF). Quotes are at the lower edge of a wide potential reversal zone. Immediate signals for a change in direction are not observed on the chart.

Week Forecast:

At the beginning of the upcoming week, there is a high probability of a "sideways" movement along the levels of the calculated resistance zone. A short-term breakthrough of its upper boundary is not ruled out. An increase in volatility, a reversal, and the beginning of a downward movement in the pound's price can be expected by the end of the week.

This image is no longer relevant

Potential Reversal Zones

Resistance:

  • 1.2700/1.2750

Support:

  • 1.2500/1.2450

Recommendations

Buying: Lack of potential and may lead to losses.

Selling: After reversal signals in the resistance area appear, they can be used for short-term fractional deals.

AUD/USD

Brief Analysis:

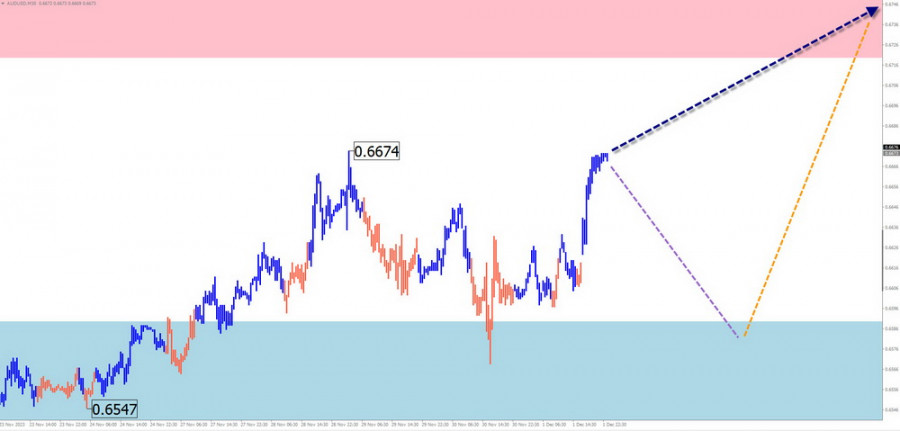
The weekly chart scale of the main pair of the Australian Dollar indicates the dominance of a descending trend. The ascending segment that started in mid-October forms a correction to the last trending segment. The structure of this movement is not complete at the time of the analysis. The price is approaching the lower boundary of the preliminary target zone.

Week Forecast:

Over the upcoming week, a gradual movement of the pair's quotes towards the calculated resistance zone is expected. The nature of oscillations is expected to be flat. A short-term decrease beyond the support zone is included in the next few days. An active growth phase is closer to the weekend.

This image is no longer relevant

Potential Reversal Zones

Resistance:

  • 0.6720/0.6770

Support:

  • 0.6590/0.6540

Recommendations

Selling: Premature until the current wave is completed.

Buying: This can be recommended with a reduced lot from the support zone after corresponding signals from your trading system (TS) appear. The resistance zone limits the potential.

USD/CHF

Brief Analysis:

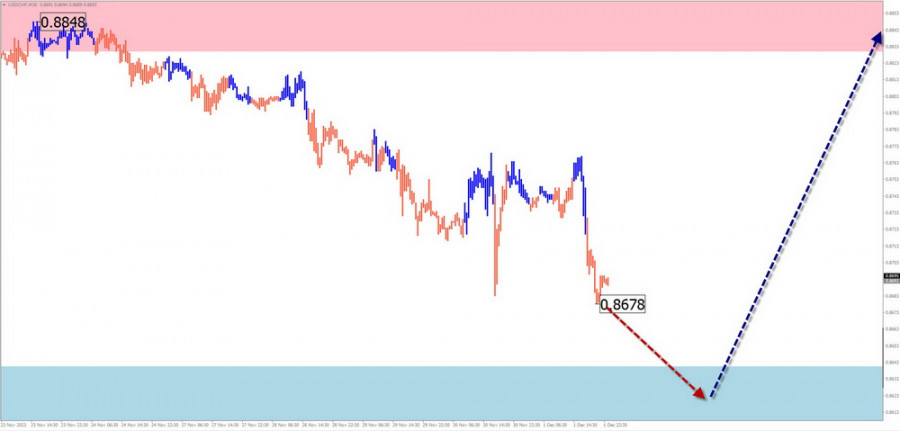
Today's unfinished wave structure resembles a flat plane and has been reported since mid-July. The structure of the wave develops in the middle part (B). This segment looks complete, but signals of an imminent change in direction are not observed on the chart.

Week Forecast:

A reversal and the beginning of a price rise can be expected after the likely pressure on the support zone on the pair's chart. The price increase is possible up to the calculated resistance. Its boundary passes along the upper edge of the preliminary target zone of the entire current wave.

This image is no longer relevant

Potential Reversal Zones

Resistance:

  • 0.8830/0.8880

Support:

  • 0.8640/0.8590

Recommendations

Selling: No conditions for such deals in the coming days.

Buying: After corresponding signals from your TS appear, they can be used for trading deals. The nearest support limits the potential.

EUR/JPY

Brief Analysis:

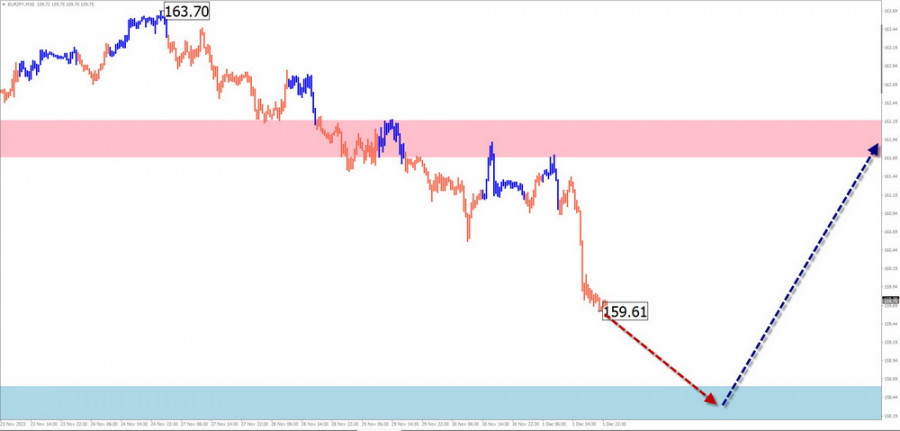
Today's unfinished wave structure of the Euro/Yen chart is ascending, starting from July 28th. The descending correction that started in mid-November exceeded the rollback level of the last segment and continued its development. Quotes are approaching the upper boundary of a powerful potential reversal zone. Signals of an imminent change in direction are not observed.

Week Forecast:

In the next few days, a gradual decrease in the cross's price is expected up to the boundaries of the calculated support. After that, the formation of a reversal and the resumption of the bullish mood of the movement can be expected. The highest activity is likely closer to the weekend.

This image is no longer relevant

Potential Reversal Zones

Resistance:

  • 161.70/162.20

Support:

  • 158.60/158.10

Recommendations

Buying: Premature until the current wave is complete.

Selling: Can be used with a fractional lot within individual sessions. It is recommended to close deals at the first signs of a reversal.

EUR/CHF

Brief Analysis:

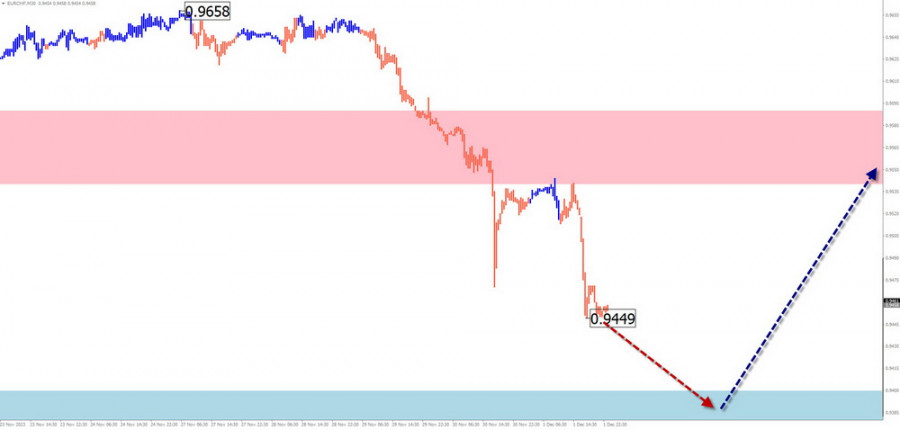
The short-term trend of the Euro/Swiss Franc cross since January of this year is directed downward. As of today, the latest trending segment reports, which are still unfinished, date back to November 20th. Its structure at the time of the analysis does not show completeness.

Week Forecast:

In the next couple of days, the price will continue to move down to the contact with the support zone. Further, the formation of a reversal and the beginning of a bullish mood of the cross can be expected. The resistance zone demonstrates the upper boundary of the maximum possible weekly movement of the pair.

This image is no longer relevant

Potential Reversal Zones

Resistance:

  • 0.9540/0.9590

Support:

  • 0.9400/0.9350

Recommendations

Buying: This will become relevant for trading after the appearance of reversal signals on your TS.

Selling: Possible with a fractional lot within individual sessions. They have limited potential.

US dollar index

Brief Analysis:

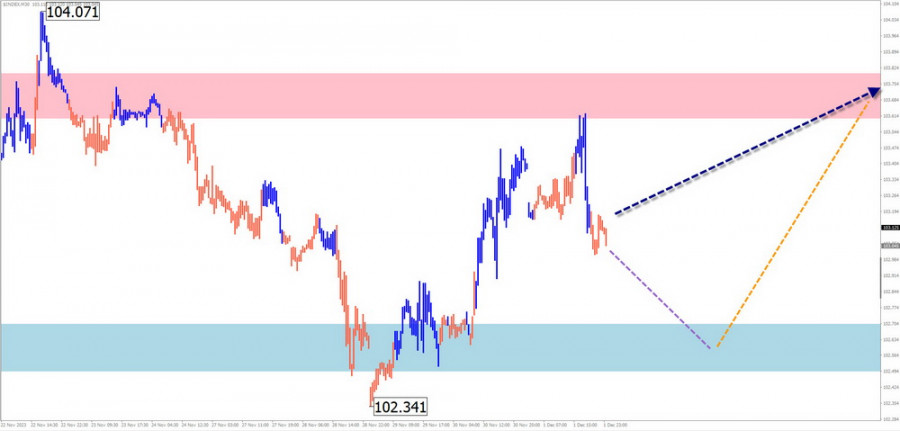
The daily scale of the US dollar index demonstrates a descending wave from October 3rd, which still needs to be completed. In the last decade, index quotes on the chart form an elongated horizontal plane.

Week Forecast:

A slight decrease in the US Dollar rate against other world currencies can be expected in the upcoming week. The trend is temporary since the calculated support limits the downward movement range. Further, an increase in dollar values is expected, not exceeding the resistance.

This image is no longer relevant

Potential Reversal Zones

Resistance:

  • 103.60/105.80

Support:

  • 102.70/102.50

Recommendations

There are no conditions for selling national currencies in the upcoming week. In the next couple of days, transactions on the

strengthening of other currencies against the US dollar may be profitable.

Notes: In simplified wave analysis (SWA), all waves consist of 3 parts (A-B-C). The analysis focuses on the last unfinished wave on each TF. Dashed lines indicate expected movements.

Attention: The wave algorithm does not consider the duration of instrument movements in time!

GBPUSD
Great Britain Pound vs US Dollar
Summary
Neutral
Urgency
1 week
Analytic
Vyacheslav Ognev
Start trade
รับผลกำไรจากการเปลี่ยนแปลงอัตราสกุลเงินดิจิทัลกับ InstaForex.
ดาวน์โหลด MetaTrader 4 และเปิดการซื้อขายครั้งแรกของคุณ.
  • Grand Choice
    Contest by
    InstaForex
    InstaForex always strives to help you
    fulfill your biggest dreams.
    เข้าร่วมการแข่งขัน


บทความแนะนำ

การวิเคราะห์ EUR/USD วันที่ 23 เมษายน 2025

โครงสร้างคลื่นในกราฟ 4 ชั่วโมงสำหรับคู่เงิน EUR/USD ได้เปลี่ยนไปเป็นรูปแบบคลื่นขาขึ้นแบบแรงกระตุ้น ฉันเชื่อว่าไม่มีใครสงสัยว่าการเปลี่ยนแปลงนี้เกิดขึ้นเพียงเพราะนโยบายการค้าใหม่ของสหรัฐอเมริกา ก่อนวันที่ 28 กุมภาพันธ์ เมื่อเงินดอลลาร์ของสหรัฐฯ เริ่มลดลงอย่างรวดเร็ว โครงสร้างคลื่นทั้งหมดดูเหมือนแนวโน้มขาลงที่แข็งแกร่ง — ก่อตัวเป็นคลื่นปรับตัว

Chin Zhao 18:44 2025-04-23 UTC+2

วิเคราะห์ GBP/USD วันที่ 23 เมษายน 2025

โครงสร้างคลื่นในกราฟ GBP/USD ก็เปลี่ยนไปในรูปแบบบูลลิชและมีแรงกระตุ้นจาก "ผลจาก" Donald Trump เช่นเดียวกัน รูปแบบคลื่นนี้เกือบจะเหมือนกับ EUR/USD จนถึงวันที่ 28 กุมภาพันธ์ เราสังเกตเห็นการพัฒนาของโครงสร้างการปรับเปลี่ยนที่น่าเชื่อถือซึ่งไม่มีความกังวลใด ๆ อย่างไรก็ตาม

Chin Zhao 18:40 2025-04-23 UTC+2

การวิเคราะห์ GBP/USD ในวันที่ 22 เมษายน 2025

รูปแบบคลื่นในกราฟ GBP/USD ยังได้แปรเปลี่ยนเป็นโครงสร้างเชิงบวกที่แรงเกินคาด — อย่างไรก็ตาม "ขอบคุณ" โดนัลด์ ทรัมป ซึ่งรูปแบบคลื่นแทบจะเหมือนกับคู่เงิน EUR/USD โดยถึงวันที่ 28 กุมภาพันธ์ เราสังเกตเห็นการเกิดโครงสร้างแก้ไขที่แน่นหนาซึ่งไม่มีปัญหา แต่หลังจากนั้น

Chin Zhao 20:05 2025-04-22 UTC+2

วิเคราะห์ EUR/USD วันที่ 21 เมษายน 2025

โครงสร้างคลื่นบนกราฟ 4 ชั่วโมงสำหรับคู่เงิน EUR/USD ได้เปลี่ยนไปสู่รูปแบบที่เป็นบวก ฉันเชื่อว่าไม่มีข้อกังขาใดที่การเปลี่ยนแปลงนี้เกิดขึ้นได้เนื่องจากนโยบายการค้าของสหรัฐฯ ที่ใหม่เท่านั้น ก่อนวันที่ 28 กุมภาพันธ์ เมื่อการลดลงอย่างรวดเร็วของดอลลาร์สหรัฐเริ่มขึ้น โครงสร้างคลื่นทั้งหมดดูเหมือนเป็นแนวโน้มขาลงที่ชัดเจน คลื่นที่ 2 ของโครงสร้างการแก้ไขกำลังก่อตัว

Chin Zhao 19:46 2025-04-21 UTC+2

วิเคราะห์ GBP/USD วันที่ 21 เมษายน 2025

โครงสร้างคลื่นสำหรับ GBP/USD ก็ได้เปลี่ยนแปลงเป็นรูปแบบที่เพิ่มสูงขึ้น (bullish) ด้วยความอนุเคราะห์จาก Donald Trump โดยภาพคลื่นนั้นแทบจะเหมือนกับ EUR/USD อย่างมาก จนถึงวันที่ 28 กุมภาพันธ์ เราได้เฝ้าสังเกตการก่อตัวของโครงสร้างที่แก้ไขที่น่าเชื่อถือซึ่งไม่ทำให้กังวล อย่างไรก็ตาม

Chin Zhao 19:44 2025-04-21 UTC+2

การพยากรณ์รายสัปดาห์บนพื้นฐานของการวิเคราะห์คลื่นที่ง่ายขึ้นสำหรับ GBP/USD, AUD/USD, USD/CHF, EUR/JPY, AUD/JPY, และดัชนีดอลลาร์สหรัฐ — 21 เมษายน

GBP/USD การวิเคราะห์: ตั้งแต่ต้นปีนี้ GBP/USD ได้มีการเคลื่อนตัวในคลื่นขาขึ้นบนกราฟรายวัน ขณะนี้คู่สกุลเงินได้มาถึงขอบเขตของโซนพลิกกลับที่เป็นไปได้ เมื่อทำการวิเคราะห์ราคาอยู่ใกล้กับพื้นที่ต้านทานที่คำนวณไว้ การพยากรณ์: ในอีกไม่กี่วันข้างหน้า คาดว่าจะมีแรงกดดันต่อโซนต้านทาน การพลิกกลับและการเริ่มเคลื่อนไหวขาลงอาจตามมา หากแนวโน้มเปลี่ยนแปลง อาจเกิดการทะลุระดับต้านทานเป็นระยะเวลาสั้น ขอบล่างของช่วงคาดการณ์รายสัปดาห์จะถูกกำหนดโดยการสนับสนุนที่คำนวณไว้ โซนกลับตัวที่อาจเกิดขึ้น

Isabel Clark 09:31 2025-04-21 UTC+2

การพยากรณ์รายสัปดาห์ตามการวิเคราะห์คลื่นอย่างง่ายสำหรับ EUR/USD, USD/JPY, GBP/JPY, USD/CAD, NZD/USD, และทองคำ – วันที่ 21 เมษายน

การวิเคราะห์: ตั้งแต่เดือนกุมภาพันธ์ EUR/USD ได้สร้างคลื่นที่เคลื่อนที่ขึ้นมา โดยที่ส่วนสุดท้าย (C) กำลังดำเนินการอยู่ เมื่อไม่นานมานี้ คู่สกุลเงินนี้ได้พุ่งผ่านขอบล่างของโซนการกลับตัวที่เป็นไปได้ที่แข็งแกร่งและอยู่ในช่วงการปรับตัวลงเชิงแก้ไข การคาดการณ์: การเคลื่อนไหวในแนวข้างคาดว่าจะเกิดขึ้นในไม่กี่วันที่จะถึงนี้ หลังจากมีโอกาสการเด้งขึ้นจากโซนแนวต้าน อาจมีการกลับทิศทางและเคลื่อนที่ลงได้ ในระยะเวลาสั้นๆ

Isabel Clark 09:25 2025-04-21 UTC+2

การวิเคราะห์ EUR/USD ประจำวันที่ 17 เมษายน 2025

โครงสร้างคลื่นในกราฟ EUR/USD ระยะ 4 ชั่วโมงได้เปลี่ยนเป็นรูปแบบแรงกระตุ้นเชิงบูลลิช ผมเชื่อว่าไม่มีข้อสงสัยว่าการเปลี่ยนแปลงนี้เกิดขึ้นเพียงเพราะนโยบายการค้าของสหรัฐฯ ใหม่ จนถึงวันที่ 28 กุมภาพันธ์ เมื่อเงินดอลลาร์สหรัฐเริ่มลดลงอย่างรวดเร็ว โครงสร้างคลื่นทั้งหมดยังคงสะท้อนรูปแบบขาลงที่น่าเชื่อถือ คลื่นแก้ไขที่ 2 กำลังดำเนินไป

Chin Zhao 19:12 2025-04-17 UTC+2

วิเคราะห์ GBP/USD วันที่ 17 เมษายน 2025

คู่สกุลเงิน GBP/USD ยังคงปราศจากการเปลี่ยนแปลงในวันพฤหัสบดี แม้จะเป็นพฤติกรรมของตลาดที่อาจคาดหวังได้สำหรับวันพฤหัสบดี แต่ค่อนข้างน่าแปลกใจที่ไม่เห็นการปรับตัวลงในวันพุธ ทั้งที่มีเหตุผลพื้นฐานหลายประการสนับสนุน รูปแบบคลื่นสำหรับ GBP/USD ก็ได้เปลี่ยนแปลงไปเป็นโครงสร้างขาขึ้นเชิงบวก — "ขอบคุณ" กับ Donald Trump รูปแบบคลื่นที่เกิดขึ้นนี้เกือบจะเหมือนกับของคู่สกุลเงิน

Chin Zhao 19:09 2025-04-17 UTC+2

การวิเคราะห์สำหรับ EUR/USD ในวันที่ 16 เมษายน 2025

โครงสร้างคลื่นบนแผนภูมิ 4 ชั่วโมงสำหรับคู่ EUR/USD ได้เปลี่ยนไปเป็นรูปแบบวาซาว (bullish). ผมคิดว่าน่าจะไม่มีความสงสัยว่าการเปลี่ยนแปลงดังกล่าวเกิดขึ้นโดยสมบูรณ์เพราะนโยบายการค้าใหม่ของสหรัฐฯ จนถึงวันที่ 28 กุมภาพันธ์ — เมื่อเริ่มต้นแนวโน้มที่ร่วงตัวของดอลลาร์สหรัฐฯ — ทั้งหมดของรูปแบบคลื่นดูเหมือนจะเป็นแนวโน้มขาลงที่คงที่ คลื่นแก้ไขลำดับที่

Chin Zhao 18:56 2025-04-16 UTC+2
หากไม่สะดวกคุยในตอนนี้
ระบุคำถามไว้ได้ใน แชท.
Widget callback
 

Dear visitor,

Your IP address shows that you are currently located in the USA. If you are a resident of the United States, you are prohibited from using the services of InstaFintech Group including online trading, online transfers, deposit/withdrawal of funds, etc.

If you think you are seeing this message by mistake and your location is not the US, kindly proceed to the website. Otherwise, you must leave the website in order to comply with government restrictions.

Why does your IP address show your location as the USA?

  • - you are using a VPN provided by a hosting company based in the United States;
  • - your IP does not have proper WHOIS records;
  • - an error occurred in the WHOIS geolocation database.

Please confirm whether you are a US resident or not by clicking the relevant button below. If you choose the wrong option, being a US resident, you will not be able to open an account with InstaForex anyway.

We are sorry for any inconvenience caused by this message.