сила сигнала 1 из 5
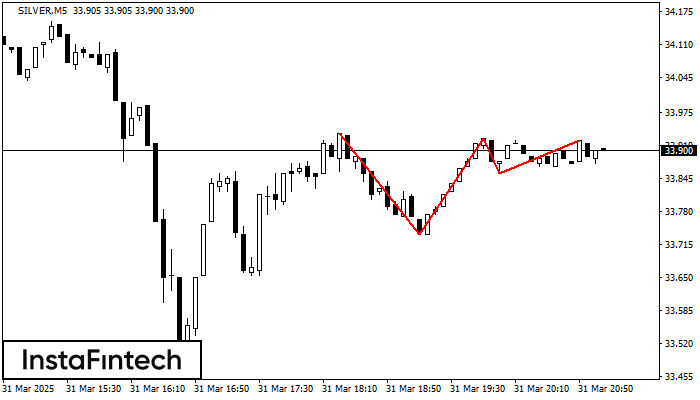
По SILVER на M5 сформировалась фигура «Тройная вершина». Характеристика: Границы имеют восходящий угол. Нижняя граница фигуры имеет координаты 33.73/33.85, при этом верхняя граница 33.94/33.92. Проекция ширины 200 пунктов. Формирование фигуры «Тройная вершина» наиболее вероятным образом свидетельствует об изменении тренда с восходящего на нисходящий. Это означает, что, в случае пробоя нижней границы 33.85, курс, с наибольшей вероятностью, продолжит нисходящее движение.
Таймфреймы М5 и М15 могут иметь больше ложных точек входа.
Дивіться також
- Все
- Вымпел
- Голова и плечи
- Двойная вершина
- Прямоугольник
- Треугольник
- Тройная вершина
- Флаг
- Все
- #AAPL
- #AMZN
- #Bitcoin
- #EBAY
- #FB
- #GOOG
- #INTC
- #KO
- #MA
- #MCD
- #MSFT
- #NTDOY
- #PEP
- #TSLA
- #TWTR
- AUDCAD
- AUDCHF
- AUDJPY
- AUDUSD
- EURCAD
- EURCHF
- EURGBP
- EURJPY
- EURNZD
- EURRUB
- EURUSD
- GBPAUD
- GBPCHF
- GBPJPY
- GBPUSD
- GOLD
- NZDCAD
- NZDCHF
- NZDJPY
- NZDUSD
- SILVER
- USDCAD
- USDCHF
- USDJPY
- USDRUB
- Все
- M5
- M15
- M30
- H1
- D1
- Все
- Покупка
- Продажа
- Все
- 1
- 2
- 3
- 4
- 5
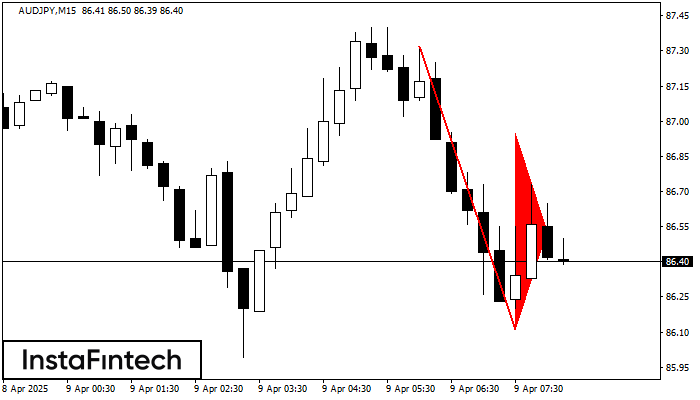
The Bearish pennant pattern has formed on the AUDJPY M15 chart. The pattern signals continuation of the downtrend in case the pennant’s low of 86.11 is broken through. Recommendations: Place
The M5 and M15 time frames may have more false entry points.
Open chart in a new window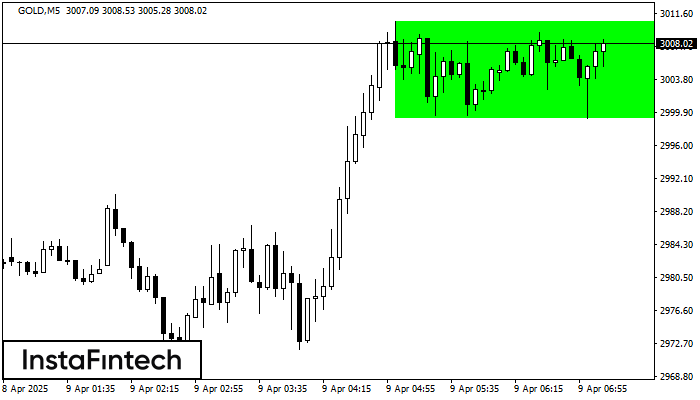
According to the chart of M5, GOLD formed the Bullish Rectangle. The pattern indicates a trend continuation. The upper border is 3010.63, the lower border is 2999.19. The signal means
The M5 and M15 time frames may have more false entry points.
Open chart in a new window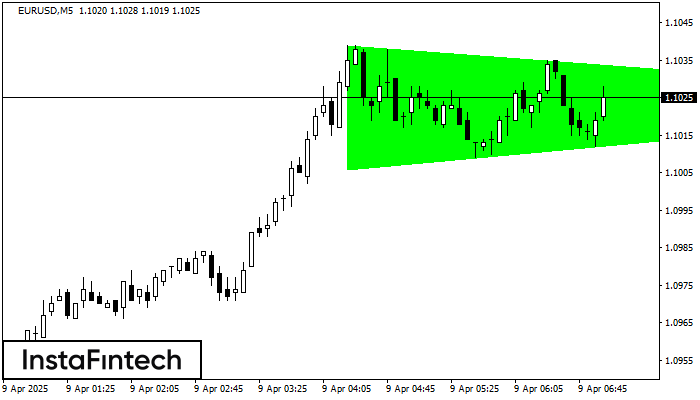
According to the chart of M5, EURUSD formed the Bullish Symmetrical Triangle pattern, which signals the trend will continue. Description. The upper border of the pattern touches the coordinates 1.1039/1.1024
The M5 and M15 time frames may have more false entry points.
Open chart in a new window